
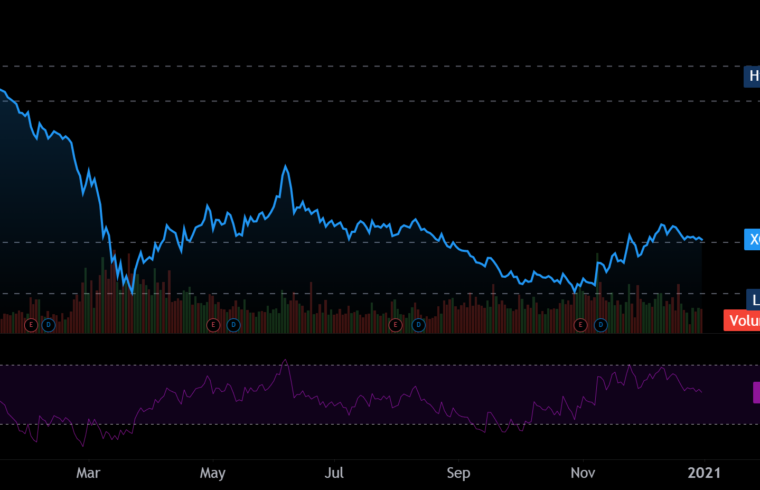
2020 Charts
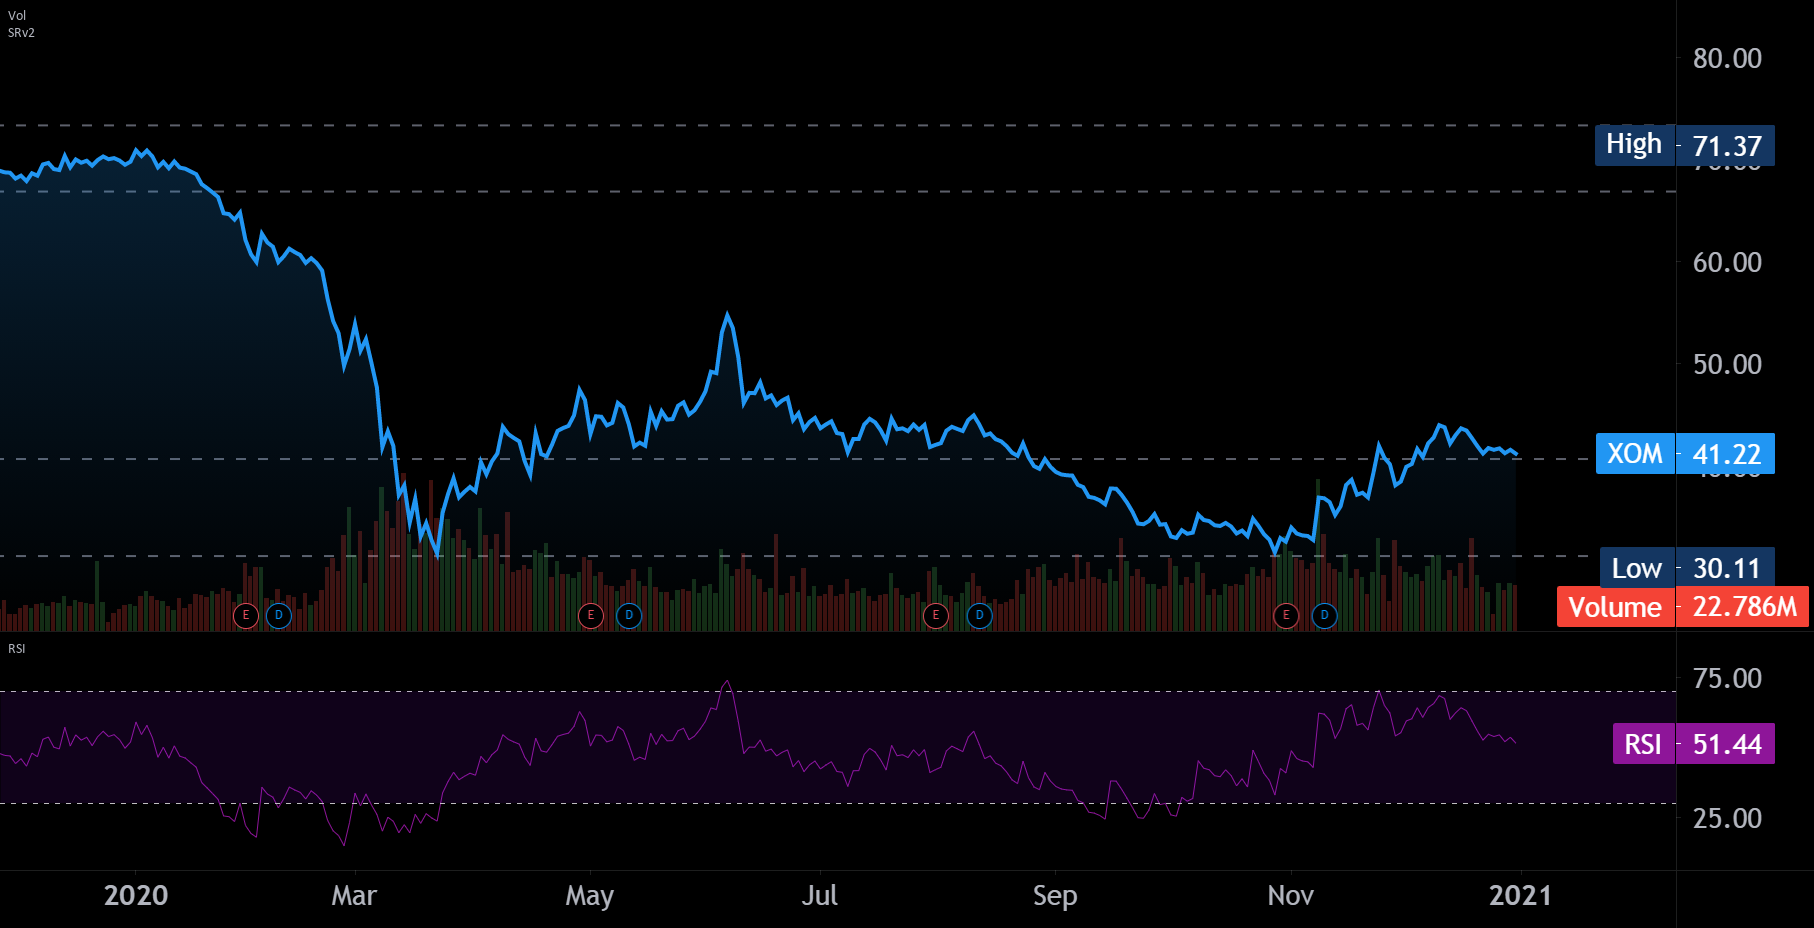
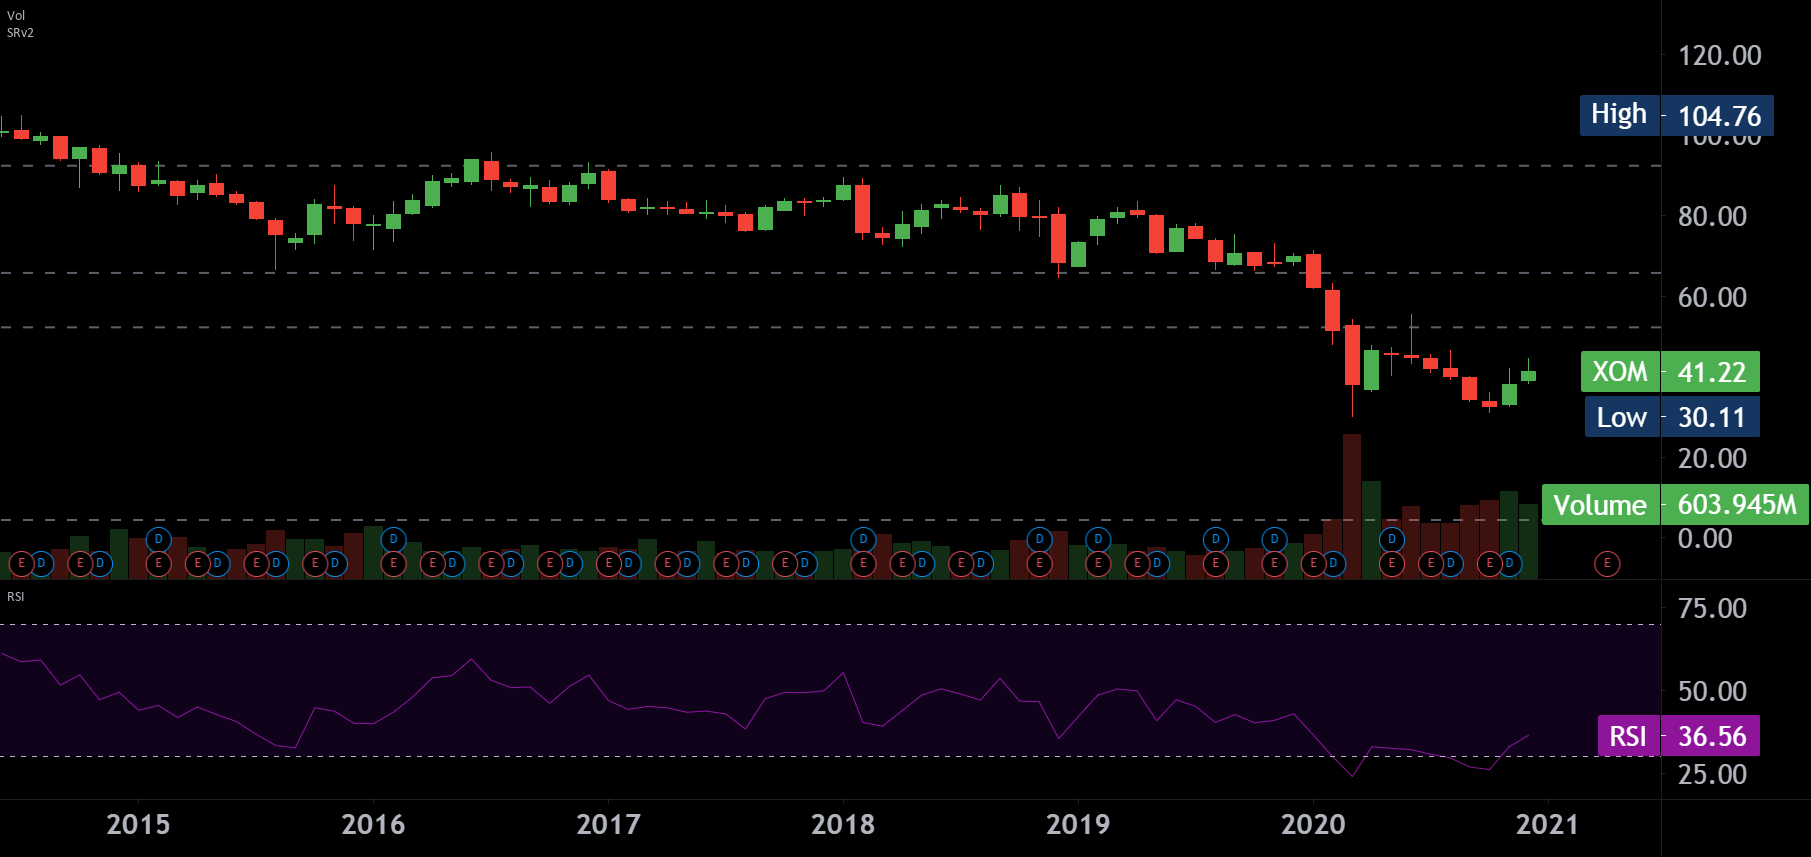
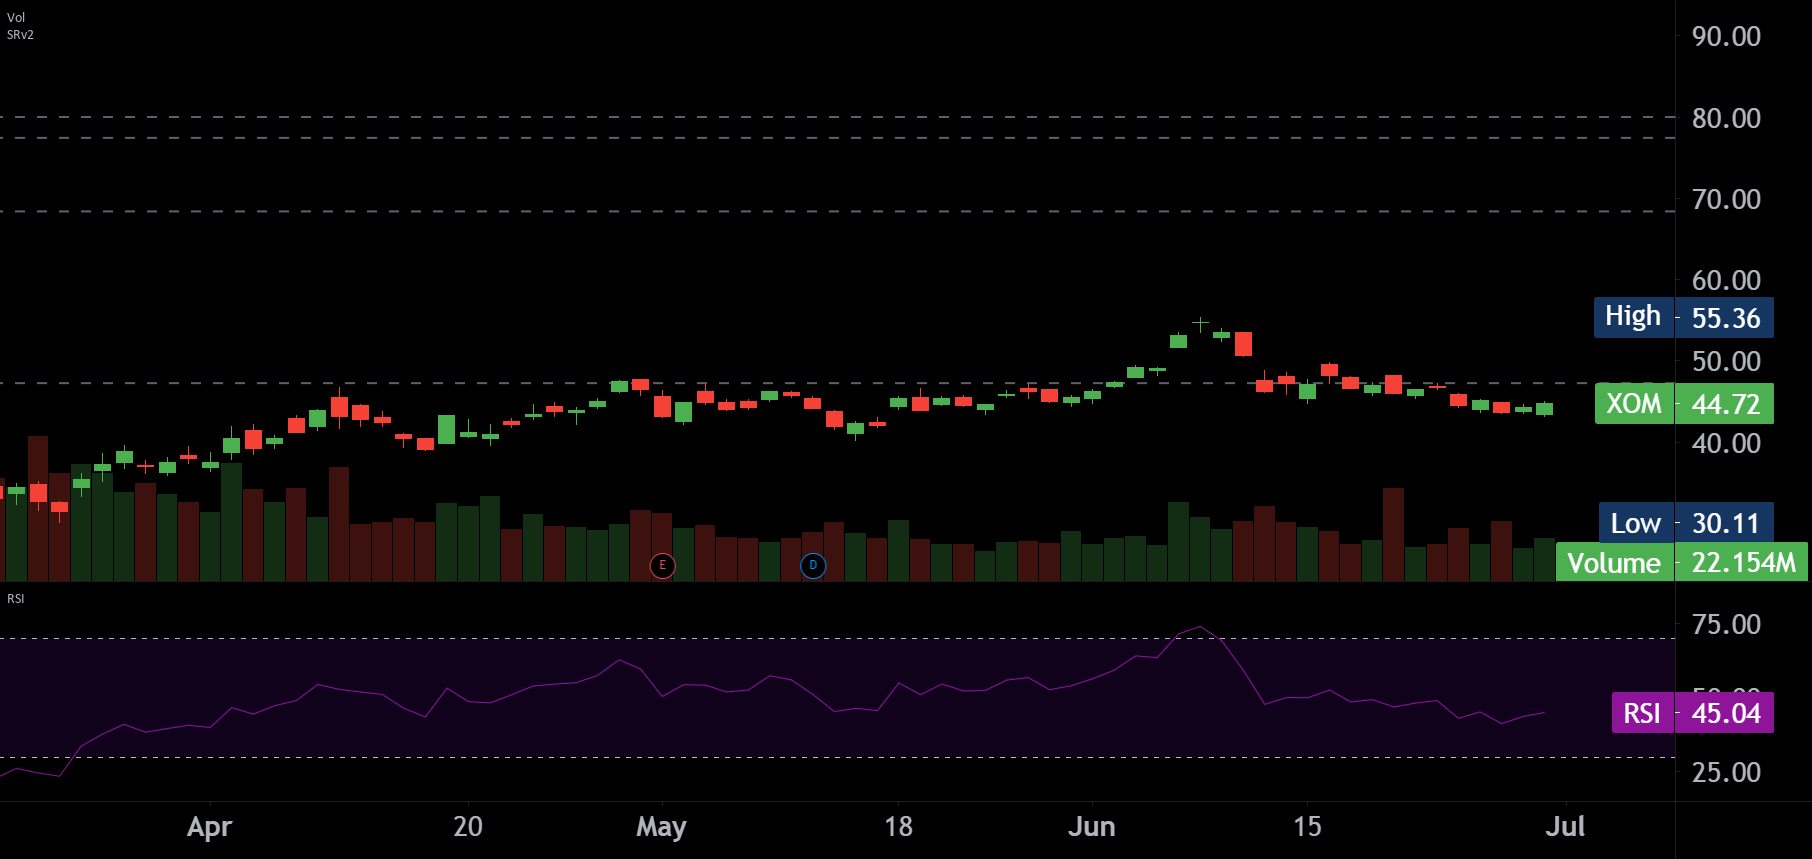
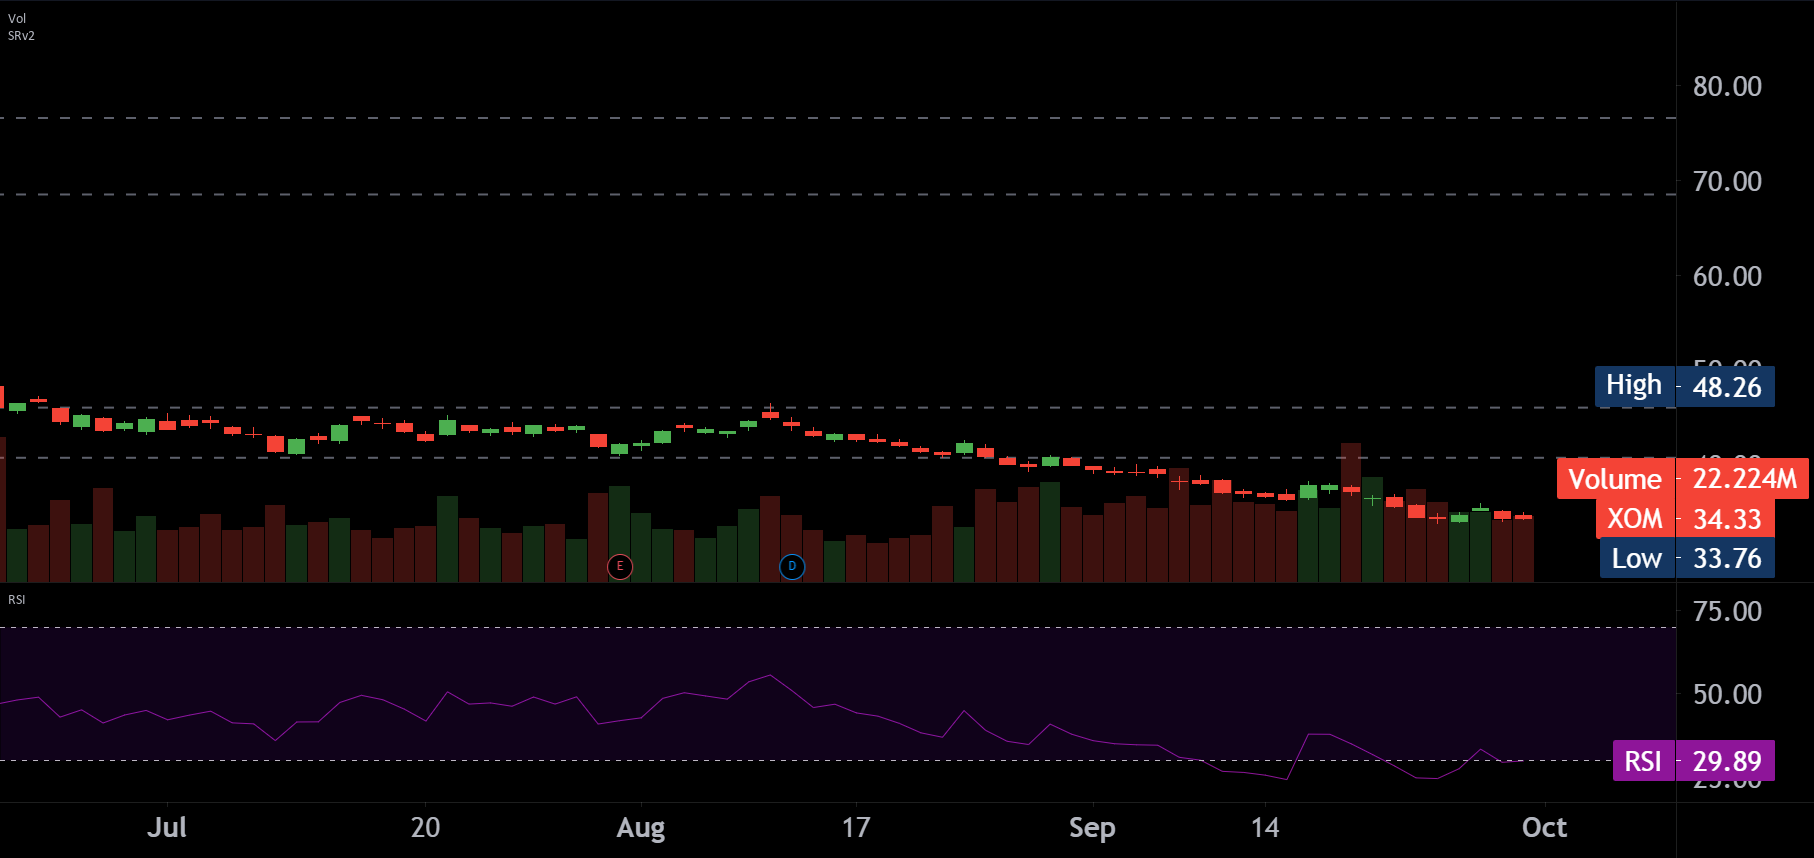
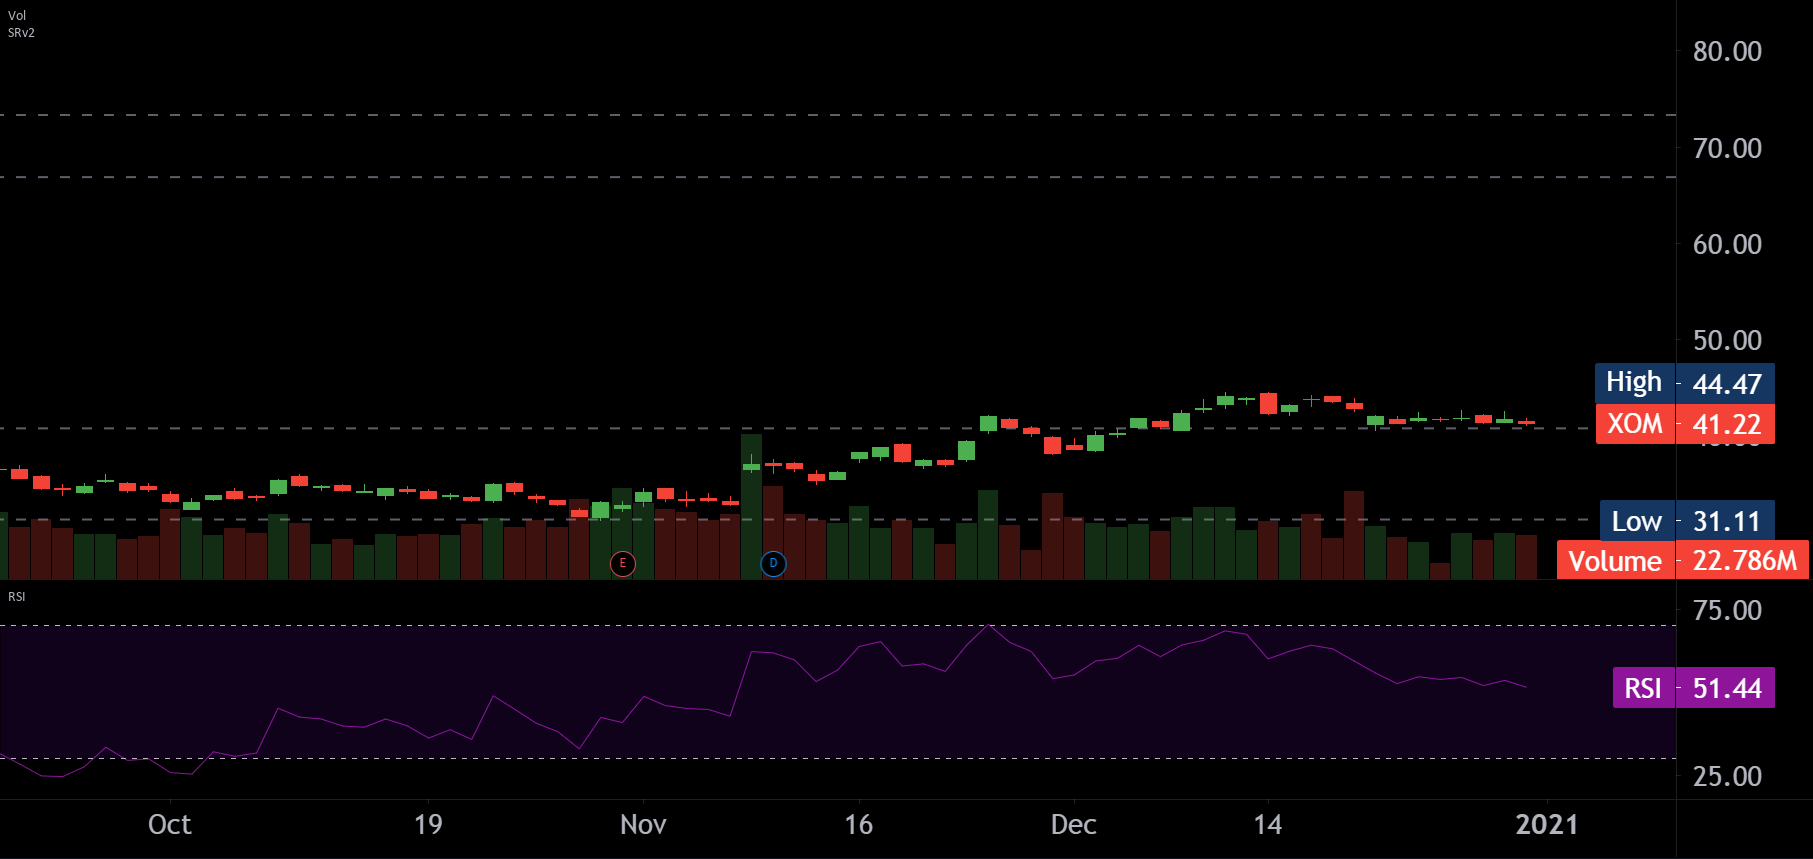
Charts by Tradingview
Company Profile
| Name | Exxon Mobil Corporation (XOM) |
| Exchange | NYSE |
| Sector | Energy |
| Industry | Oil & Gas Integrated |
| Country | USA |
| Description | Exxon Mobil Corporation explores for and produces crude oil and natural gas in the United States and internationally. It operates through Upstream, Downstream, and Chemical segments. The company is also involved in the manufacture, trade, transport, and sale of crude oil, natural gas, petroleum products, petrochemicals, and other specialty products; and manufactures and sells petrochemicals, including olefins, polyolefins, aromatics, and various other petrochemicals. As of December 31, 2020, it had approximately 22,239 net operated wells with proved reserves. The company was founded in 1870 and is based in Irving, Texas. Exxon Mobil Corporation explores for and produces crude oil and natural gas in the United States and internationally. It operates through Upstream, Downstream, and Chemical segments. The company is also involved in the manufacture, trade, transport, and sale of crude oil, natural gas, petroleum products, petrochemicals, and other specialty products… |
Price Action
| Symbol | XOM |
| Difference | -29.71 |
| % Difference | -42.30% |
| Closing Price | 40.53 |
Moving Averages
| EOY 2020 | Moving Average |
| 50 Day MA | 38.48 |
| 100 Day MA | 37.99 |
| 200 Day MA | 40.82 |
Industry Year Comparison
| Symbol | Company Name | Open | Close | Difference | % Diff. |
| XOM | Exxon Mobil Corporation (XOM) | 70.24 | 40.53 | -29.71 | -42.30% |
| CVX | Chevron Corporation (CVX) | 120.81 | 83.27 | -37.54 | -31.07% |
| TOT | TOTAL SE (TOT) | 55.14 | 41.91 | -13.23 | -23.99% |
| PTR | PetroChina Company Limited (PTR) | 50.71 | 30.72 | -19.99 | -39.42% |
| BP | BP p.l.c. (BP) | 38.04 | 20.25 | -17.79 | -46.77% |
| SNP | China Petroleum & Chemical Corporation (SNP) | 60.52 | 44.60 | -15.92 | -26.31% |
| EQNR | Equinor ASA (EQNR) | 20.27 | 16.32 | -3.95 | -19.49% |
| PBR | Petróleo Brasileiro S.A. – Petrobras (PBR) | 16.04 | 11.23 | -4.81 | -29.99% |
| EQNR | Equinor ASA (EQNR) | 20.27 | 16.32 | -3.95 | -19.49% |
| SU | Suncor Energy Inc. (SU) | 32.93 | 16.65 | -16.28 | -49.44% |
| EC | Ecopetrol S.A. (EC) | 20.15 | 12.91 | -7.24 | -35.93% |
| IMO | Imperial Oil Limited (IMO) | 26.50 | 18.88 | -7.62 | -28.75% |
| CVE | Cenovus Energy Inc. (CVE) | 10.18 | 6.04 | -4.14 | -40.67% |
| SSL | Sasol Limited (SSL) | 21.57 | 8.86 | -12.71 | -58.92% |
| NFG | National Fuel Gas Company (NFG) | 46.60 | 41.13 | -5.47 | -11.74% |
| YPF | YPF Sociedad Anónima (YPF) | 11.51 | 4.70 | -6.81 | -59.17% |
| TK | Teekay Corporation (TK) | 5.35 | 2.15 | -3.20 | -59.81% |
| AE | Adams Resources & Energy, Inc. (AE) | 38.52 | 23.91 | -14.61 | -37.93% |
NEWS
| Title | Date | News | Source |
| Exxon Mobil EPS misses by $0.04, beats on revenue | Friday, January 31, 2020 | Exxon Mobil (NYSE:XOM): Q3 Non-GAAP EPS of $0.41 misses by $0.04; GAAP EPS of $1.33 beats by $0.79. Revenue of $67.17B (+3.3% Y/Y) beats by $2.59B. | via SA News |
| Dow posts worst point drop ever | Thursday, February 27, 2020 | The Dow Jones Industrial Average fell over 1,193 points, its worst single point drop ever, as selling accelerated into the close of trading. | via Fox Business |
| Exxon Mobil EPS beats by $0.47, misses on revenue | Friday, May 1, 2020 | Exxon Mobil (NYSE:XOM): Q1 Non-GAAP EPS of $0.53 beats by $0.47; GAAP EPS of -$0.14 misses by $0.18. Revenue of $56.16B (-11.7% Y/Y) misses by $2.09B. Shares -3.7% PM. | via SA News |
| Exxon loses $610 million in the first quarter | Friday, May 1, 2020 | Exxon Mobil on Friday reported its first loss in decades as oil prices plunged to historic lows following a drop-off in demand caused by the coronavirus. | via CNBC |
| Exxon Mobil EPS misses by $0.10, misses on revenue | Friday, July 31, 2020 | Exxon Mobil (NYSE:XOM): Q2 Non-GAAP EPS of -$0.70 misses by $0.10; GAAP EPS of -$0.26 beats by $0.28. Revenue of $32.61B (-52.8% Y/Y) misses by $5.55B. Q2 Production of 3.64 Mboe/d vs. consensus of 3.43 Mboe/d. Shares -0.9% PM. | via SA News |
| Exxon Mobil Exits: The Dow Drops Its Oldest Member | Tuesday, August 25, 2020 | The oil giant — currently the Dow’s longest-tenured member — will be dropped from the influential index, which for many people is shorthand for the stock market. | via NPR |
| Exxon Mobil EPS beats by $0.06, misses on revenue | Friday, October 30, 2020 | Exxon Mobil (NYSE:XOM): Q3 Non-GAAP EPS of -$0.18 beats by $0.06; GAAP EPS of -$0.15 beats by $0.11. Revenue of $46.2B (-29.0% Y/Y) misses by $2.16B. Production of 3.67 Mboe/d vs. consensus of 3.72 Mboe/d. | via SA News |
| Can Exxon Stock Bounce Back in 2021? | Monday, December 28, 2020 | This past year might go down as the worst in ExxonMobil’s (NYSE:XOM) history. Thanks to cratering oil prices, the oil giant lost billions of dollars through the third quarter and is expected to record a historic writedown approaching $20 billion for the fourth quarter. | via Motley Fool |
This information is for educational purposes and is not a investment recommendation nor to be representative of professional expertise, but to be used as a forum for opening discussions around trading. All examples and analysis used herin are for illustration purposes only, and of the personal opinions of the Original Posts author. All examples and analysis are intended for these purposes and should not be considered as specific investment advice.


