
2020 Charts
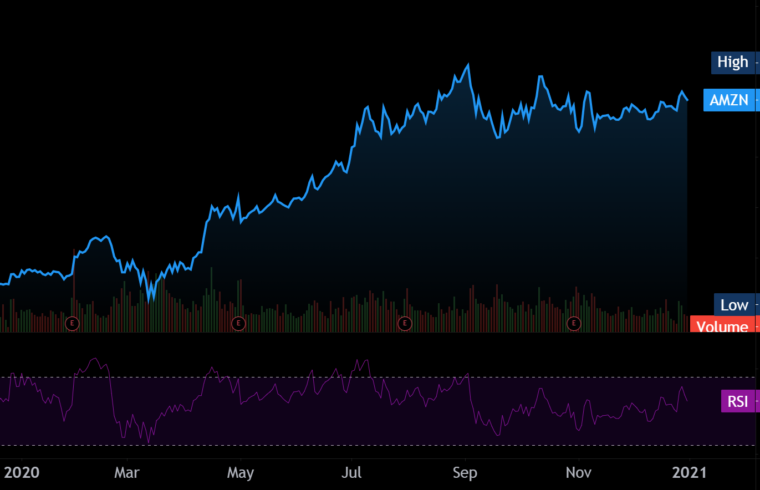
2020 Line Chart 
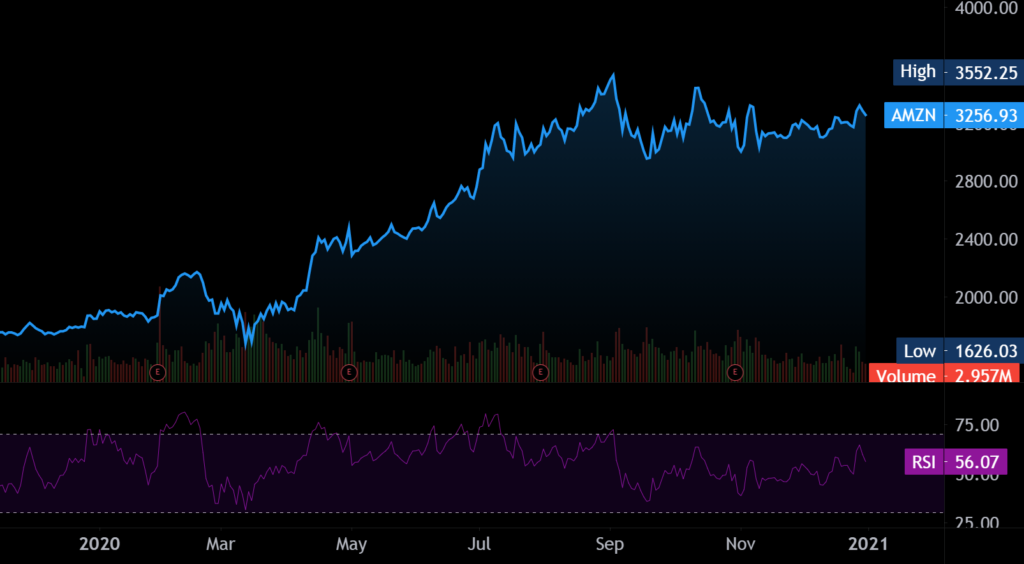
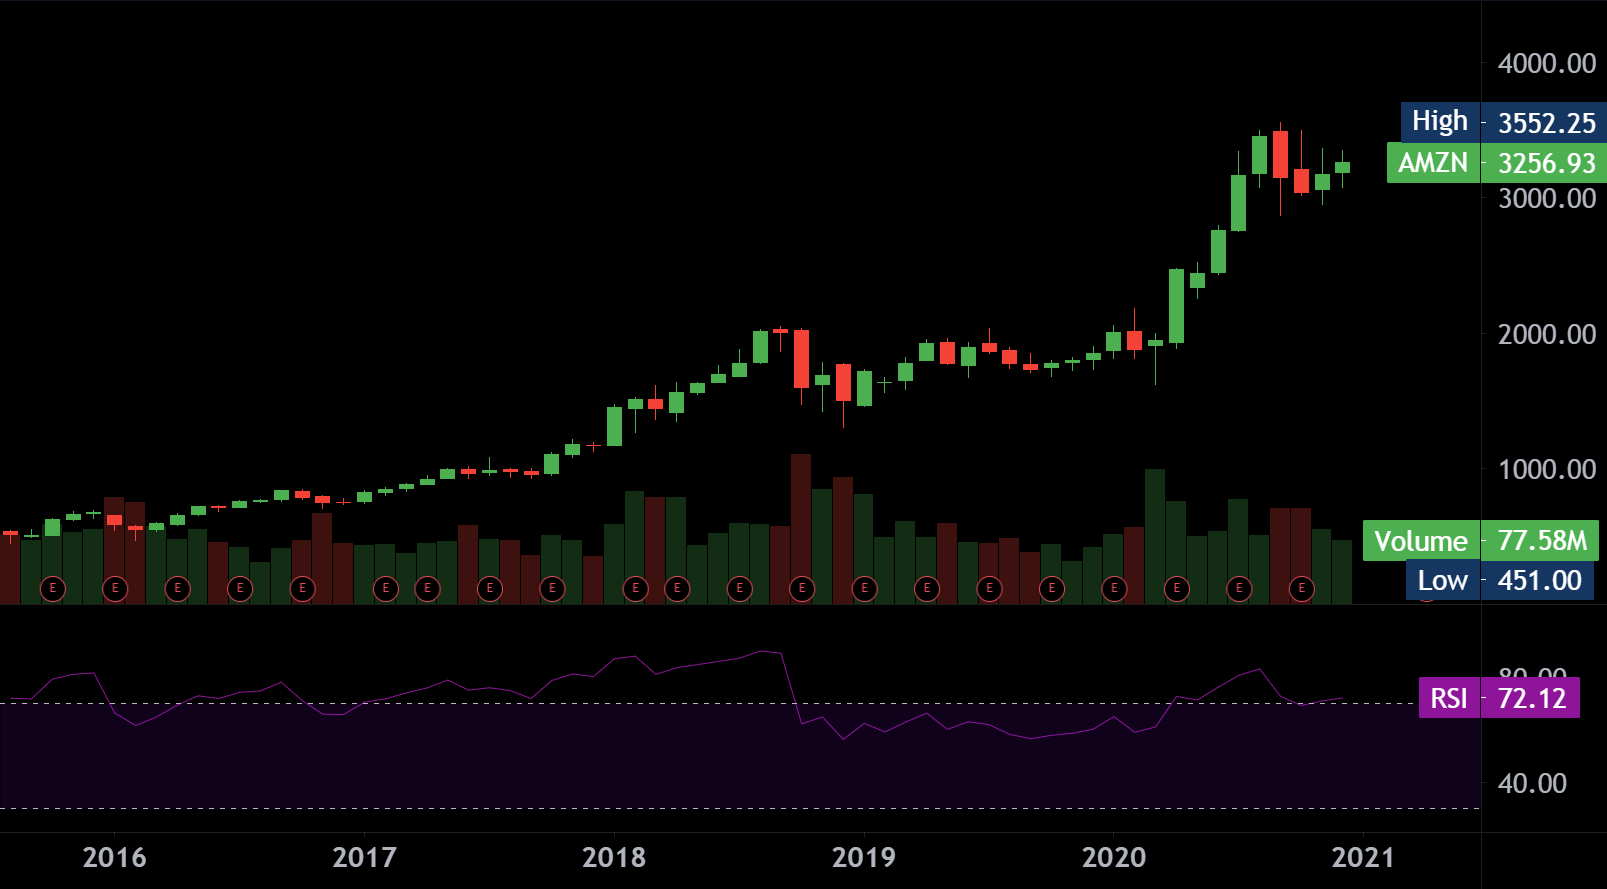
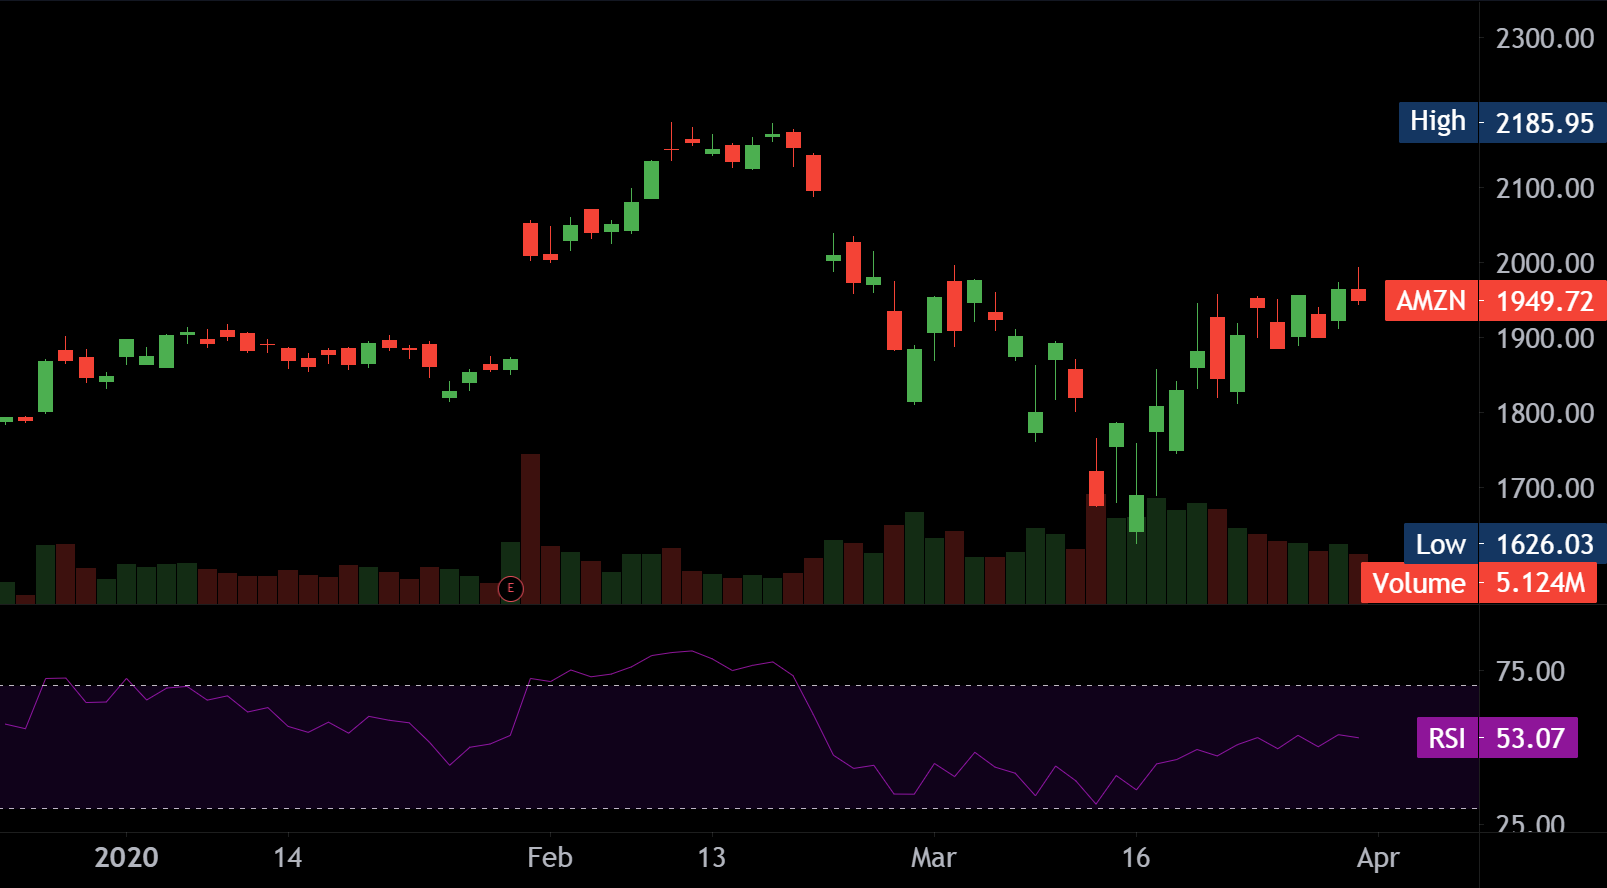
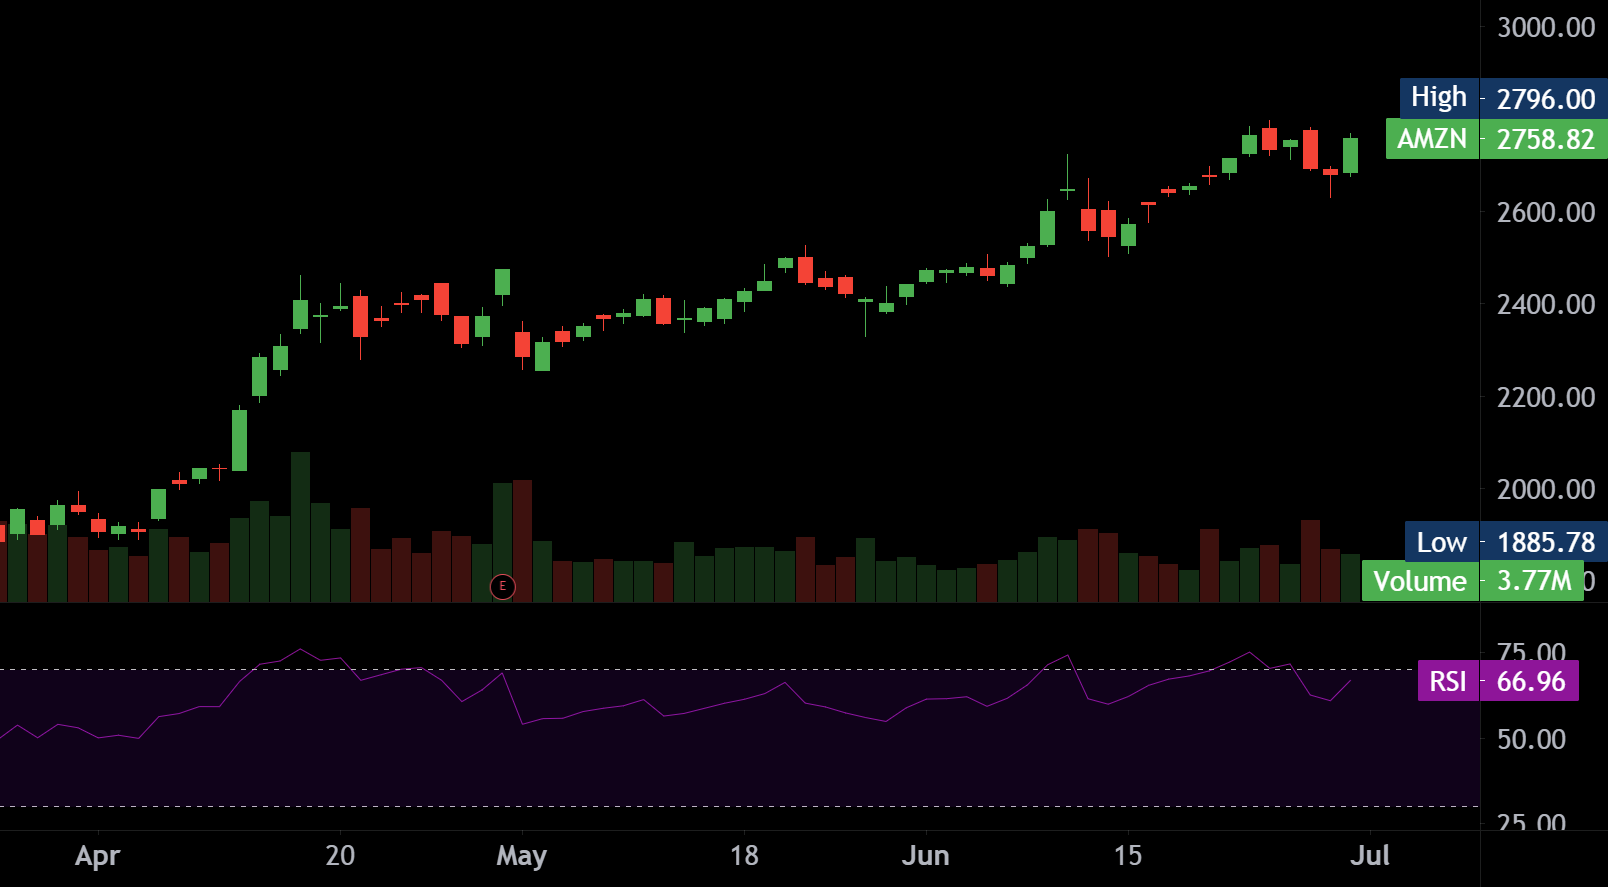
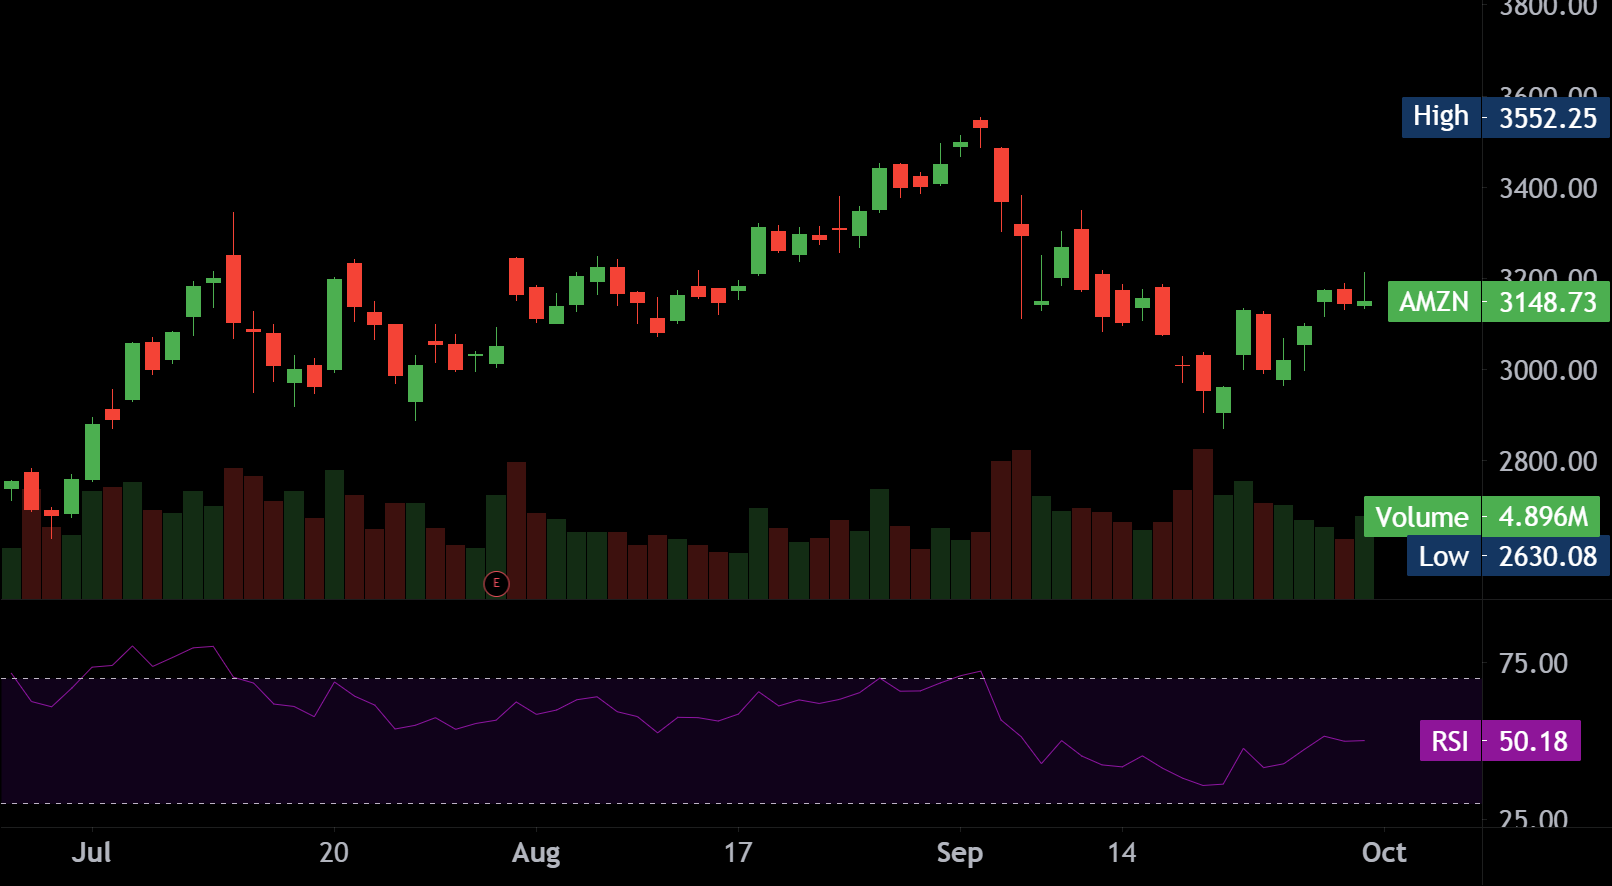
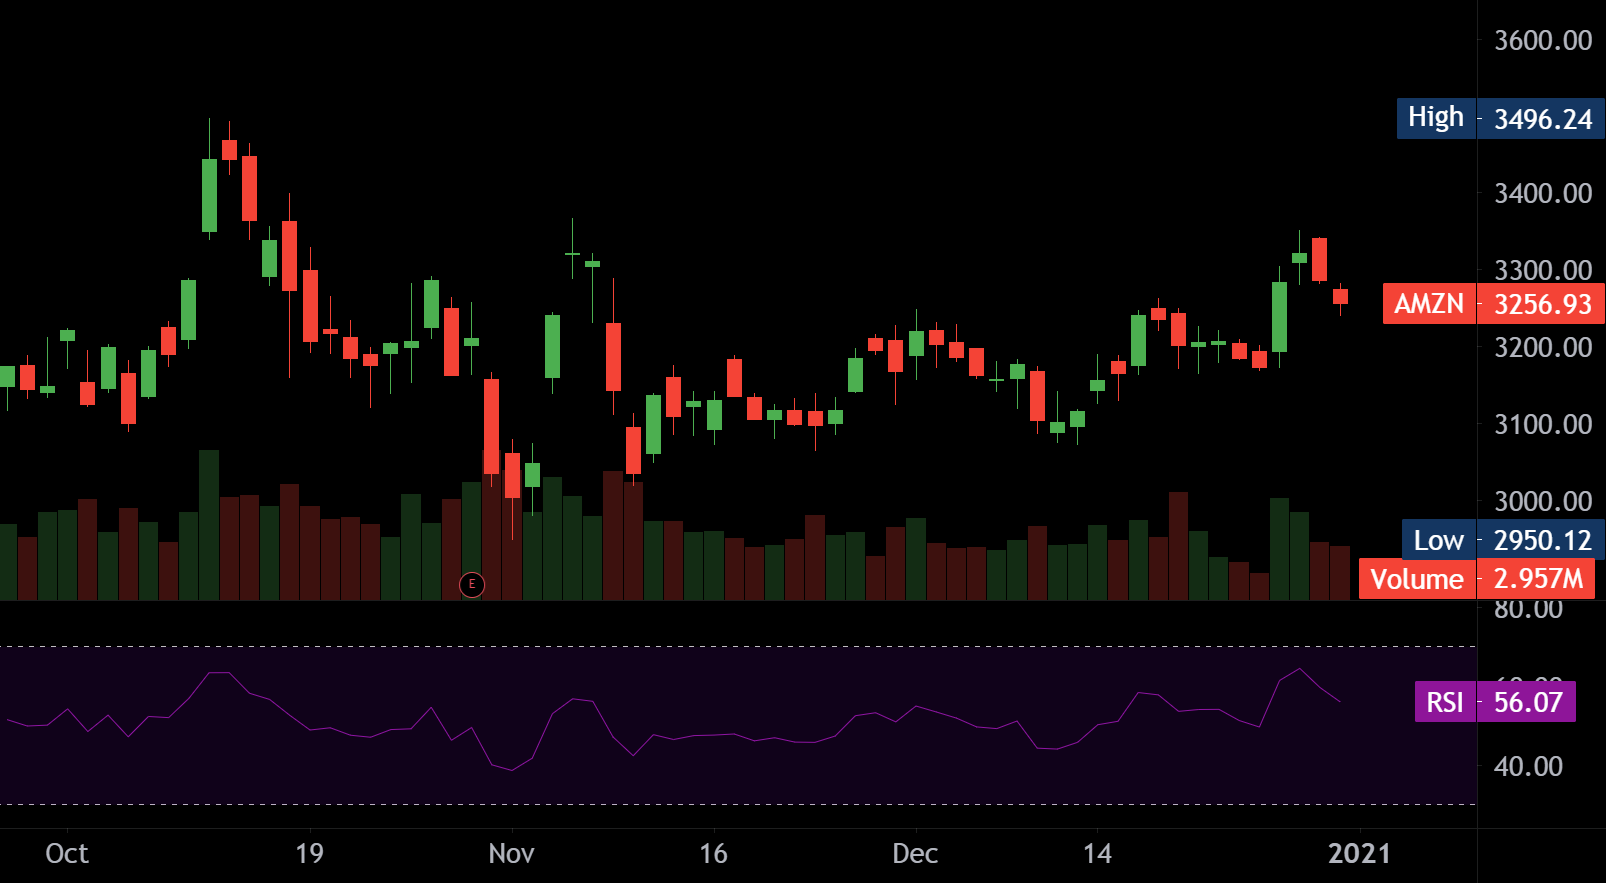
2020 Year Candlestick Chart 2020 Q1 Daily Candlestick Chart 2020 Q2 Daily Candlestick Chart 2020 Q3 Daily Candlestick Chart 2020 Q4 Daily Candlestick Chart

Charts by Tradingview
Company Profile
| Name | Amazon.com, Inc. |
| Exchange | NASDAQ |
| Sector | Consumer Cyclical |
| Industry | Internet Retail |
| Country | USA |
| Description | Amazon.com, Inc. engages in the retail sale of consumer products and subscriptions in North America and internationally. The company operates through three segments: North America, International, and Amazon Web Services (AWS). It sells merchandise and content purchased for resale from third-party sellers through physical and online stores. The company also manufactures and sells electronic devices, including Kindle, Fire tablets, Fire TVs, Rings, and Echo and other devices; provides Kindle Direct Publishing, an online service that allows independent authors and publishers to make their books available in the Kindle Store; and develops and produces media content. In addition, it offers programs that enable sellers to sell their products on its websites, as well as its stores; and programs that allow authors, musicians, filmmakers, skill and app developers, and others to publish and sell content. Further, the company provides compute, storage, database, analytics, machine learning… |
Price Action
| Symbol | AMZN |
| Difference | $1,381.93 |
| % Difference | 73.70% |
| Closing Price | $3,256.93 |
Moving Averages
| EOY 2020 | Moving Average |
| 50 Day | $3,173.11 |
| 100 Day | $3,198.74 |
| 200 Day | $2,877.32 |
Industry Year Comparison
| Symbol | Company Name | Open | Close | Difference | % Diff. |
| AMZN | Amazon.com, Inc. | $1,875.00 | $3,256.93 | $1,381.93 | 73.70% |
| BABA | Alibaba Group Holding Limited | $216.60 | $232.73 | $16.13 | 7.45% |
| PDD | Pinduoduo Inc. | $38.50 | $177.67 | $139.17 | 361.48% |
| JD | JD.com, Inc. | $35.96 | $87.90 | $51.94 | 144.44% |
| MELI | MercadoLibre, Inc. | $576.94 | $1,675.22 | $1,098.28 | 190.36% |
| CVNA | Carvana Co. | $93.21 | $239.54 | $146.33 | 156.99% |
| EBAY | eBay Inc. | $36.41 | $50.25 | $13.84 | 38.01% |
| CHWY | Chewy, Inc. | $29.32 | $89.89 | $60.57 | 206.58% |
| W | Wayfair Inc. | $91.63 | $225.81 | $134.18 | 146.44% |
| VIPS | Vipshop Holdings Limited | $14.27 | $28.11 | $13.84 | 96.99% |
| ETSY | Etsy, Inc. | $44.71 | $177.91 | $133.20 | 297.92% |
| FTCH | Farfetch Limited | $10.46 | $63.81 | $53.35 | 510.04% |
| OZON | Ozon Holdings PLC | $38.90 | $41.41 | $2.51 | 6.45% |
| WISH | ContextLogic Inc. | $21.50 | $18.24 | -$3.26 | -15.16% |
| FVRR | Fiverr International Ltd. | $24.00 | $195.10 | $171.10 | 712.92% |
| DADA | Dada Nexus Limited | $17.08 | $36.50 | $19.42 | 113.70% |
| BZUN | Baozun Inc. | $33.99 | $34.35 | $0.36 | 1.06% |
| QRTEA | Qurate Retail, Inc. | $8.56 | $10.97 | $2.41 | 28.15% |
| JMIA | Jumia Technologies AG | $6.93 | $40.35 | $33.42 | 482.25% |
| RVLV | Revolve Group, Inc. | $18.53 | $31.17 | $12.64 | 68.21% |
| OSTK | Overstock.com, Inc. | $7.08 | $47.97 | $40.89 | 577.54% |
NEWS
| Title | Date | News | Source |
| Amazon EPS beats by $2.51, beats on revenue | Thursday, January 30, 2020 | Amazon (NASDAQ:AMZN): Q4 GAAP EPS of $6.47 beats by $2.51. Revenue of $87.44B (+20.8% Y/Y) beats by $1.35B. Shares +7%. | via SA News |
| Jeff Bezos has sold nearly $4.1 billion worth of Amazon shares in the past 11 days | Tuesday, February 11, 2020 | Amazon CEO Jeff Bezos has sold nearly $4.1 billion shares in his company over the past 11 days, according to filings with the Securities and Exchange Commission. The transactions were made as part of a prearranged trading plan. | via CNBC |
| Amazon EPS misses by $1.10, beats on revenue | Thursday, April 30, 2020 | Amazon (NASDAQ:AMZN): Q1 GAAP EPS of $5.01 misses by $1.10. Revenue of $75.5B (+26.5% Y/Y) beats by $1.41B. Total revenue in North America was $46.1B vs. $44.3B consensus. AWS revenue came in at $10.2B vs. $10.3B consensus. Shares -2.75%. | via SA News |
| Amazon Stock Rose for a Ninth Straight Week. Yes, That’s a Record. | Thursday, July 2, 2020 | Amazon.com is rising again on Thursday, the last day of trading before the Independence Day holiday weekend, and looks set to notch its ninth straight weekly gain, marking its longest winning streak in history. | via Barrons |
| Amazon EPS beats by $8.80, beats on revenue, AWS revenue falls short | Thursday, July 30, 2020 | Amazon (NASDAQ:AMZN): Q2 GAAP EPS of $10.30 beats by $8.80. Revenue of $88.91B (+40.2% Y/Y) beats by $7.62B. AWS Revenue of $10.81B vs. consensus of $11.02B. Free cash flow increased to $31.9B for the trailing twelve months. Shares +4.4%. | via SA News |
| Amazon posts biggest profit ever at height of pandemic in U.S. | Thursday, July 30, 2020 | Amazon.com Inc AMZN.O on Thursday posted the biggest profit in its 26-year history as online sales and its lucrative business supporting third-party merchants surged during the coronavirus pandemic. | via Reuters |
| Amazon EPS beats by $4.98, beats on revenue | Thursday, October 29, 2020 | Amazon (NASDAQ:AMZN): Q3 GAAP EPS of $12.37 beats by $4.98. Revenue of $96.1B (+37.3% Y/Y) beats by $3.54B. Operating income of $6.1B vs. $4.77B consensus. Q4 revenue guidance of $112B-$121B vs. $112.40B consensus. Q4 operating income guidance of $1B-$4.5B. Shares +1.2%. | via SA News |
| Amazon has already had its most profitable year ever, and just set a record for sales in a quarter | Thursday, October 29, 2020 | Amid pandemic surge, Amazon has already outpaced 2019’s record annual profit ahead of fourth quarter that will include Prime Day as well as Black Friday and other holiday shopping | via Marketwatch |
This information is for educational purposes and is not a investment recommendation nor to be representative of professional expertise, but to be used as a forum for opening discussions around trading. All examples and analysis used herin are for illustration purposes only, and of the personal opinions of the Original Posts author. All examples and analysis are intended for these purposes and should not be considered as specific investment advice.


